Choosing the right tool for interactive dashboards

flexdashboard, Quarto, and Shiny


Isabella Velásquez

ShinyConf 2025

Introduction

@ivelasq

@ivelasq3

@ivelasq3

ivelasq.rbind.io

Motivation

Motivation

Planning your trip

  • What’s the purpose of this journey? (Purpose: KPIs, trends)
  • Who’s coming with you? (Audience: execs, public, analysts?)
  • How often will this trip happen? (Once? Daily?)
  • What do you need to bring? (Data sources, interactivity, servers, customization)
  • Are you on an exploratory (self-serve) or explanatory (guided) route?

All aboard!

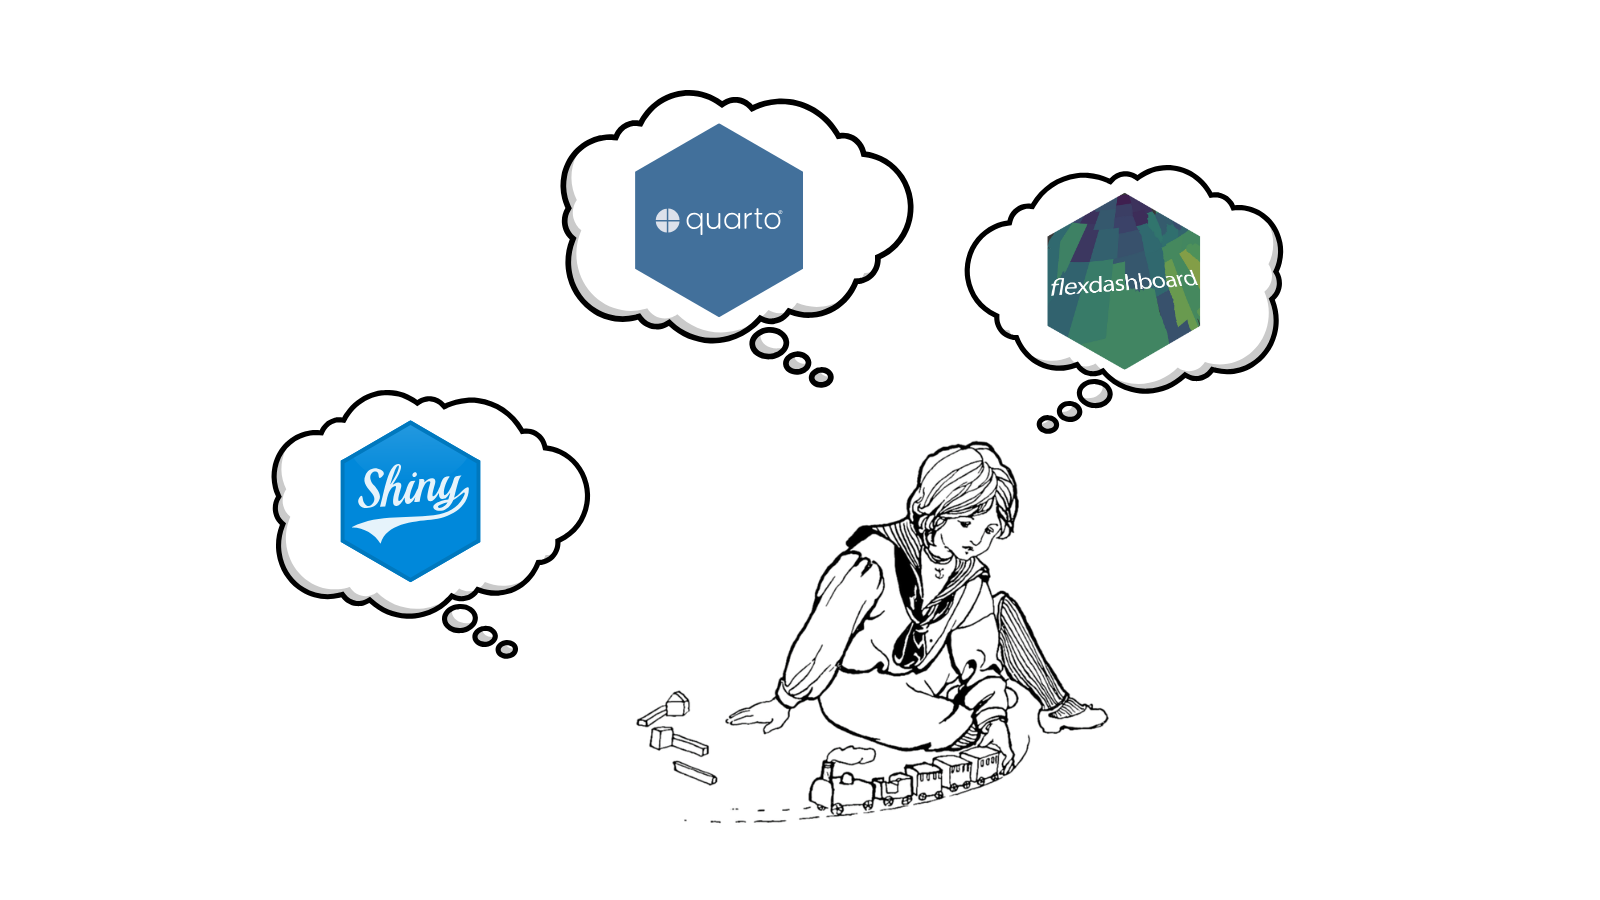
Today’s dashboard options

flexdashboard

  • “Make it easy to create interactive dashboards for R using R Markdown”
  • Markdown-based (uses document-centric format)
  • Allows for easy organization with R Markdown’s dashboard layout options
  • Lightweight, static dashboards with optional Shiny interactivity
  • Deployment in HTML file or Shiny Server
  • R package (requires R)

Quarto dashboard

  • Released in Quarto 1.4
  • Successor to flexdashboard with modern enhancements
  • Markdown-based (uses document-centric format)
  • Integrates many of the features that are in separate packages to R Markdown into Quarto
  • Supports multiple languages natively (R, Python, Julia, Observable)

  • Command-line tool (CLI)

Shiny

  • Fully interactive, reactive framework for web applications
  • Supports user input, dynamic filtering, and real-time updates
  • R or Python based, HTML/JavaScript/CSS optional
  • Traditional Shiny requires a server for deployment
  • Shinylive allows for serverless apps (i.e., run entirely in the browser)

Your dashboard options (expanded)

  • flexdashboard (No Shiny): Simple, static dashboards in R Markdown
  • flexdashboard (With Shiny): Reactive dashboards with basic Shiny support

  • Quarto Dashboard (No Shiny): Static dashboards in Quarto format
  • Quarto Dashboard (With Shiny): Reactive dashboards with basic Shiny support

  • Traditional Shiny: Full R or Python-based web applications
  • Shinylive: Run Shiny apps in the browser, no server needed

Which track to take?

The reactivity route

Some routes are automatic
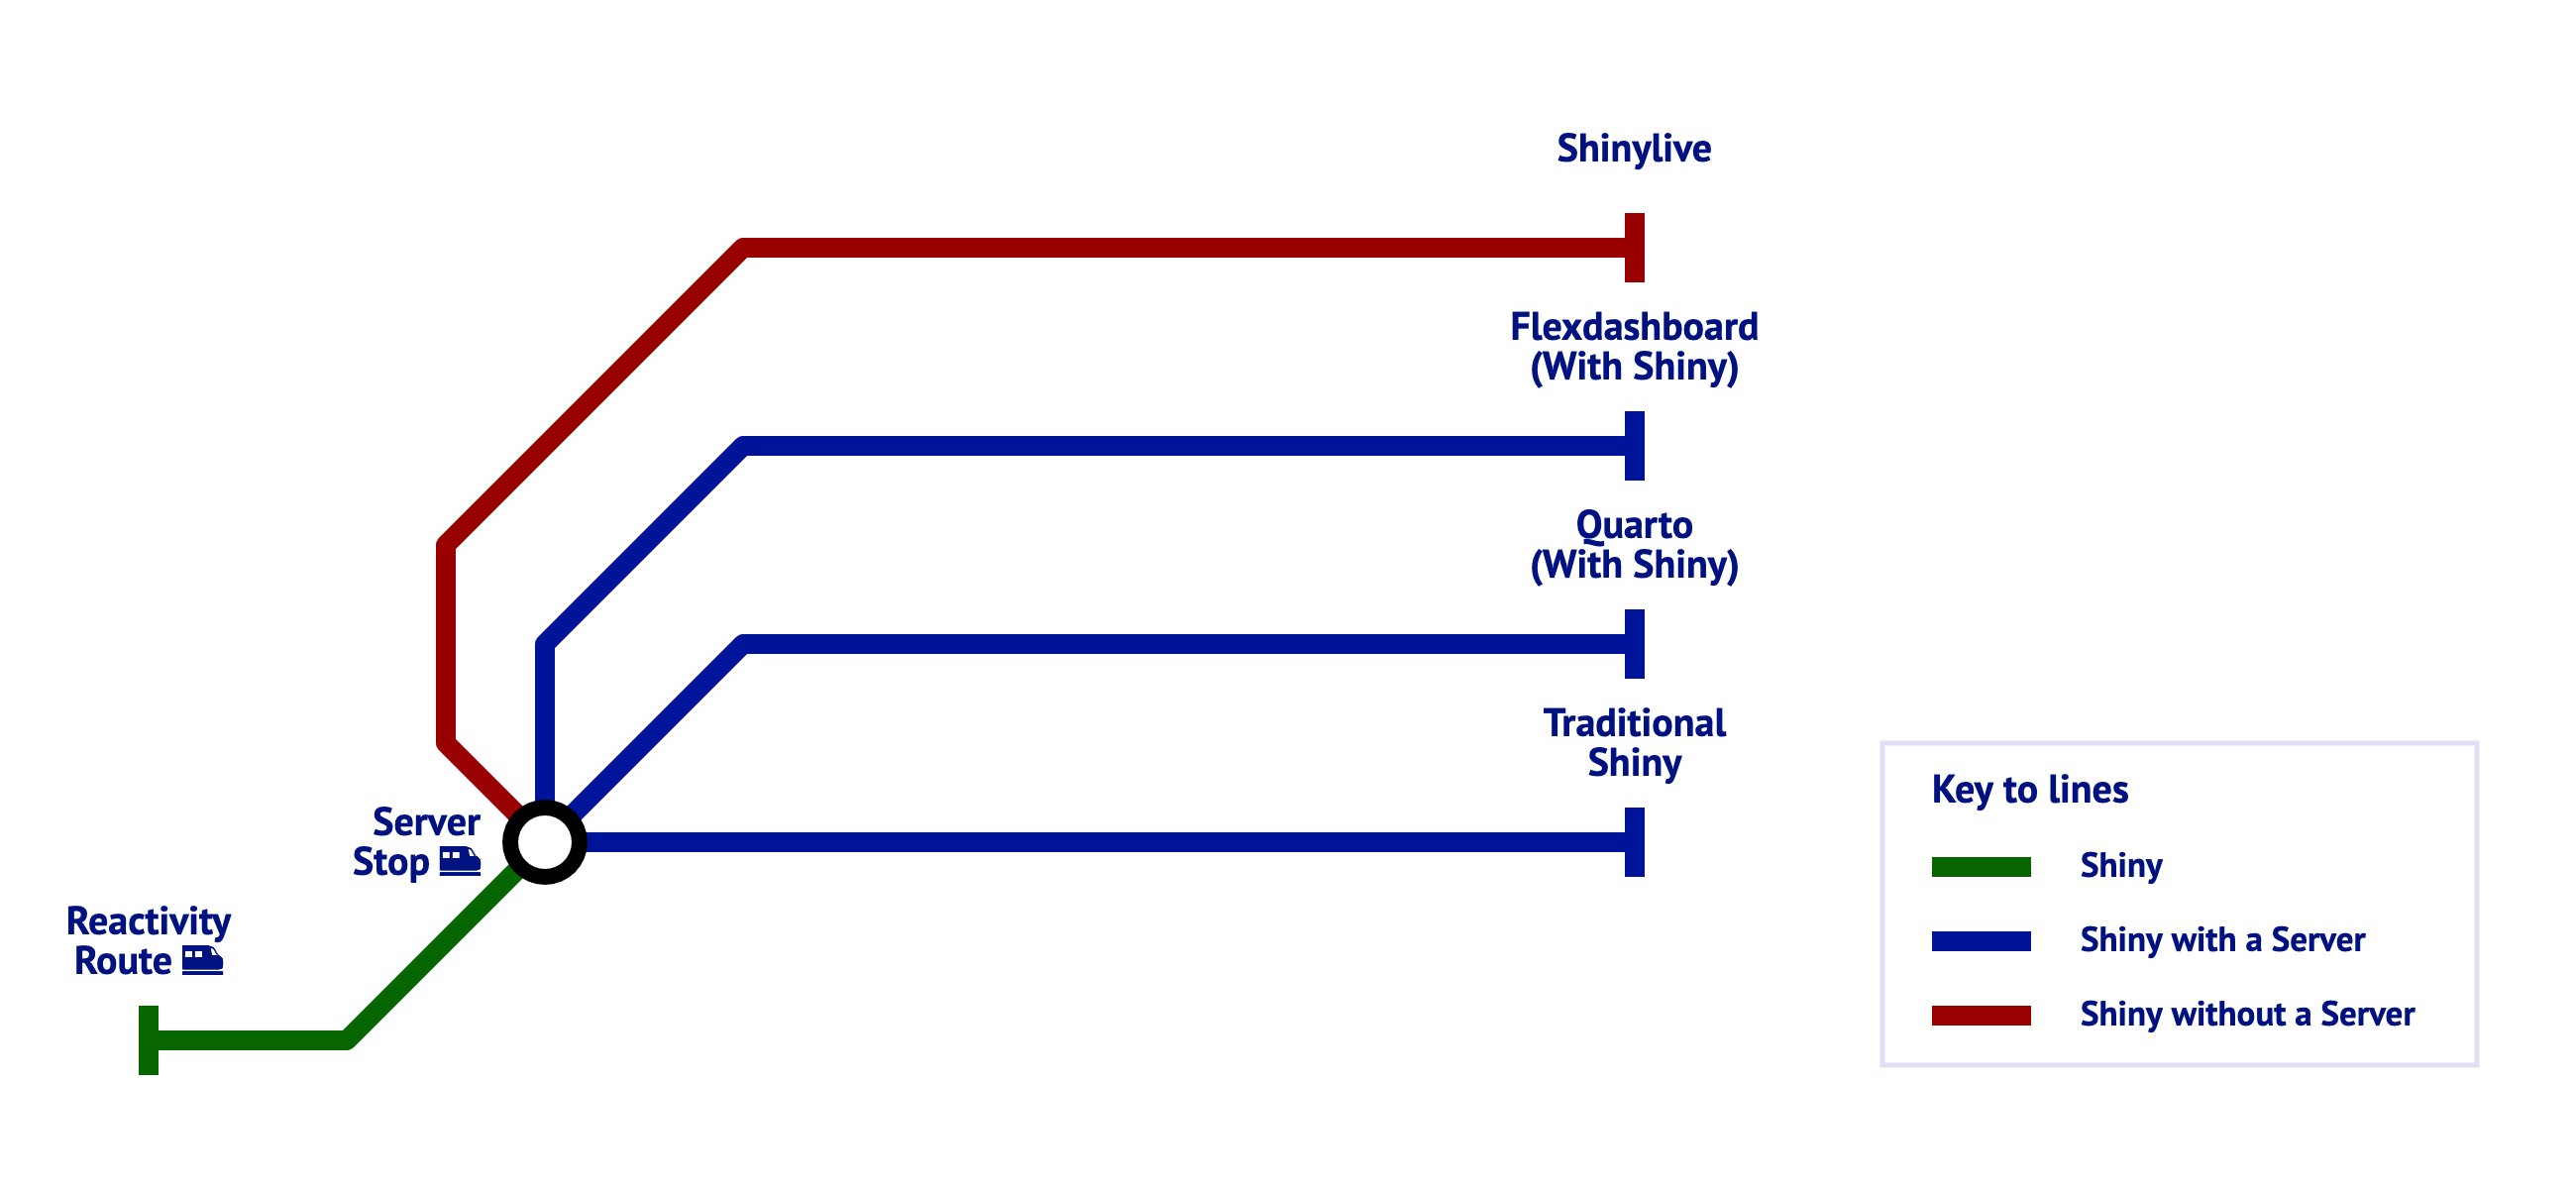
And sometimes, you choose your route

Thinking back on the planning questions from before, determine:

  • How big is your data?
  • Can your data be hosted online?
  • How much interactivity is really needed?
  • Is this for long-term use or a one-time project?

Mind the gap

Even if a track looks right, proceed with caution!

Considering your options

  • flexdashboard (No Shiny): Simple, static dashboards in R Markdown
  • flexdashboard (With Shiny): Reactive dashboards with basic Shiny support

  • Quarto Dashboard (No Shiny): Static dashboards in Quarto format
  • Quarto Dashboard (With Shiny): Reactive dashboards with basic Shiny support

  • Traditional Shiny: Full R or Python-based web applications
  • Shinylive: Run Shiny apps in the browser, no server needed

Is Flexdashboard (No Shiny) Right for You?

✅ Good Option If…

  • You prefer R Markdown’s simple document format.
  • You want a static dashboard with no server needed.
  • Your dashboard shows key metrics, no deep filters.
  • Interactivity like tooltips or plot zoom is enough.
  • You like quick setup with familiar syntax.

🚫 Avoid If…

  • You need real-time filtering or dynamic content.
  • Your users need to upload or download data.
  • You require Shiny widgets or reactive elements.
  • Your data is too large to precompute.

Is Flexdashboard (With Shiny) Right for You?

✅ Good Option If…

  • You like flexdashboard’s layout but need interactivity.
  • Your dashboard needs basic filtering, dropdowns, or reactive elements.
  • You want to avoid building a full Shiny app but still use reactive components.
  • You can host it on a Shiny server like Posit Connect.

🚫 Avoid If…

  • You need a fully custom UI.
  • Your dashboard handles complex user workflows or multi-page interactions.
  • You want a modern, multi-language-friendly or Python-native approach.
  • You need full Shiny functionality (Shinywidgets, etc.).

Is Quarto (No Shiny) Right for You?

✅ Good Option If…

  • You want to use Quarto’s modern, document-focused format.
  • You work in R, Python, Observable, or Julia (multi-language support).
  • You need a static dashboard deployed as an HTML file.
  • You want a quick way to build dashboards using Markdown-like syntax.
  • You only need light interactivity, like tooltips or zooming.
  • You want full Quarto features like cross-format consistency and extensions.

🚫 Avoid If…

  • You need reactivity, like filters or user inputs.
  • Your dashboard must handle uploads or query large datasets dynamically.
  • You need highly customized layouts or UI logic.

Is Quarto (With Shiny) Right for You?

✅ Good Option If…

  • You want reactivity in a modern, markdown-based format.
  • You work in R or Python and want flexibility across languages.
  • You plan to include charts, filters, and user inputs.
  • You’re deploying to Posit Connect, shinyapps.io, or another server.
  • You like the idea of using one tool for different formats (docs, dashboards, slides, etc.).

🚫 Avoid If…

  • Your users must upload files or trigger complex workflows.
  • You want to host the dashboard without a server.
  • You’re unfamiliar with Quarto and need something quicker to prototype.

Is Traditional Shiny Right for You?

✅ Good Option If…

  • You need full interactivity with dropdowns, sliders, text inputs, and dynamic outputs.
  • Your app requires persistent storage.
  • You require session-based interactions or user authentication.
  • You want full control over the layout and design of your app.
  • Your data must be processed dynamically, not precomputed.
  • You want the full power of the Shiny ecosystem.

🚫 Avoid If…

  • You only need a static or lightly interactive dashboard.
  • You do not have a way to deploy to a server.
  • You need a document-style report with occasional interactive elements.

Is Shinylive Right for You?

✅ Good Option If…

  • You need Shiny-like interactivity but don’t want to host a server.
  • You want a fully client-side app embedded in a website or report.
  • You have a way to host or share HTML files easily (GitHub, Netlify, etc.).

🚫 Avoid If…

  • You need quick start up times.
  • You need to connect directly with a database (might be doable but tricky).
  • Your dashboard requires persistent data storage beyond local browser state.
  • You have large datasets that exceed what can be loaded in the browser.
  • Your data is sensitive and cannot be shared on the client side.
  • You want to use an R or Python package that is not available.

Route selection

Example 1: R-Ladies Video Feed

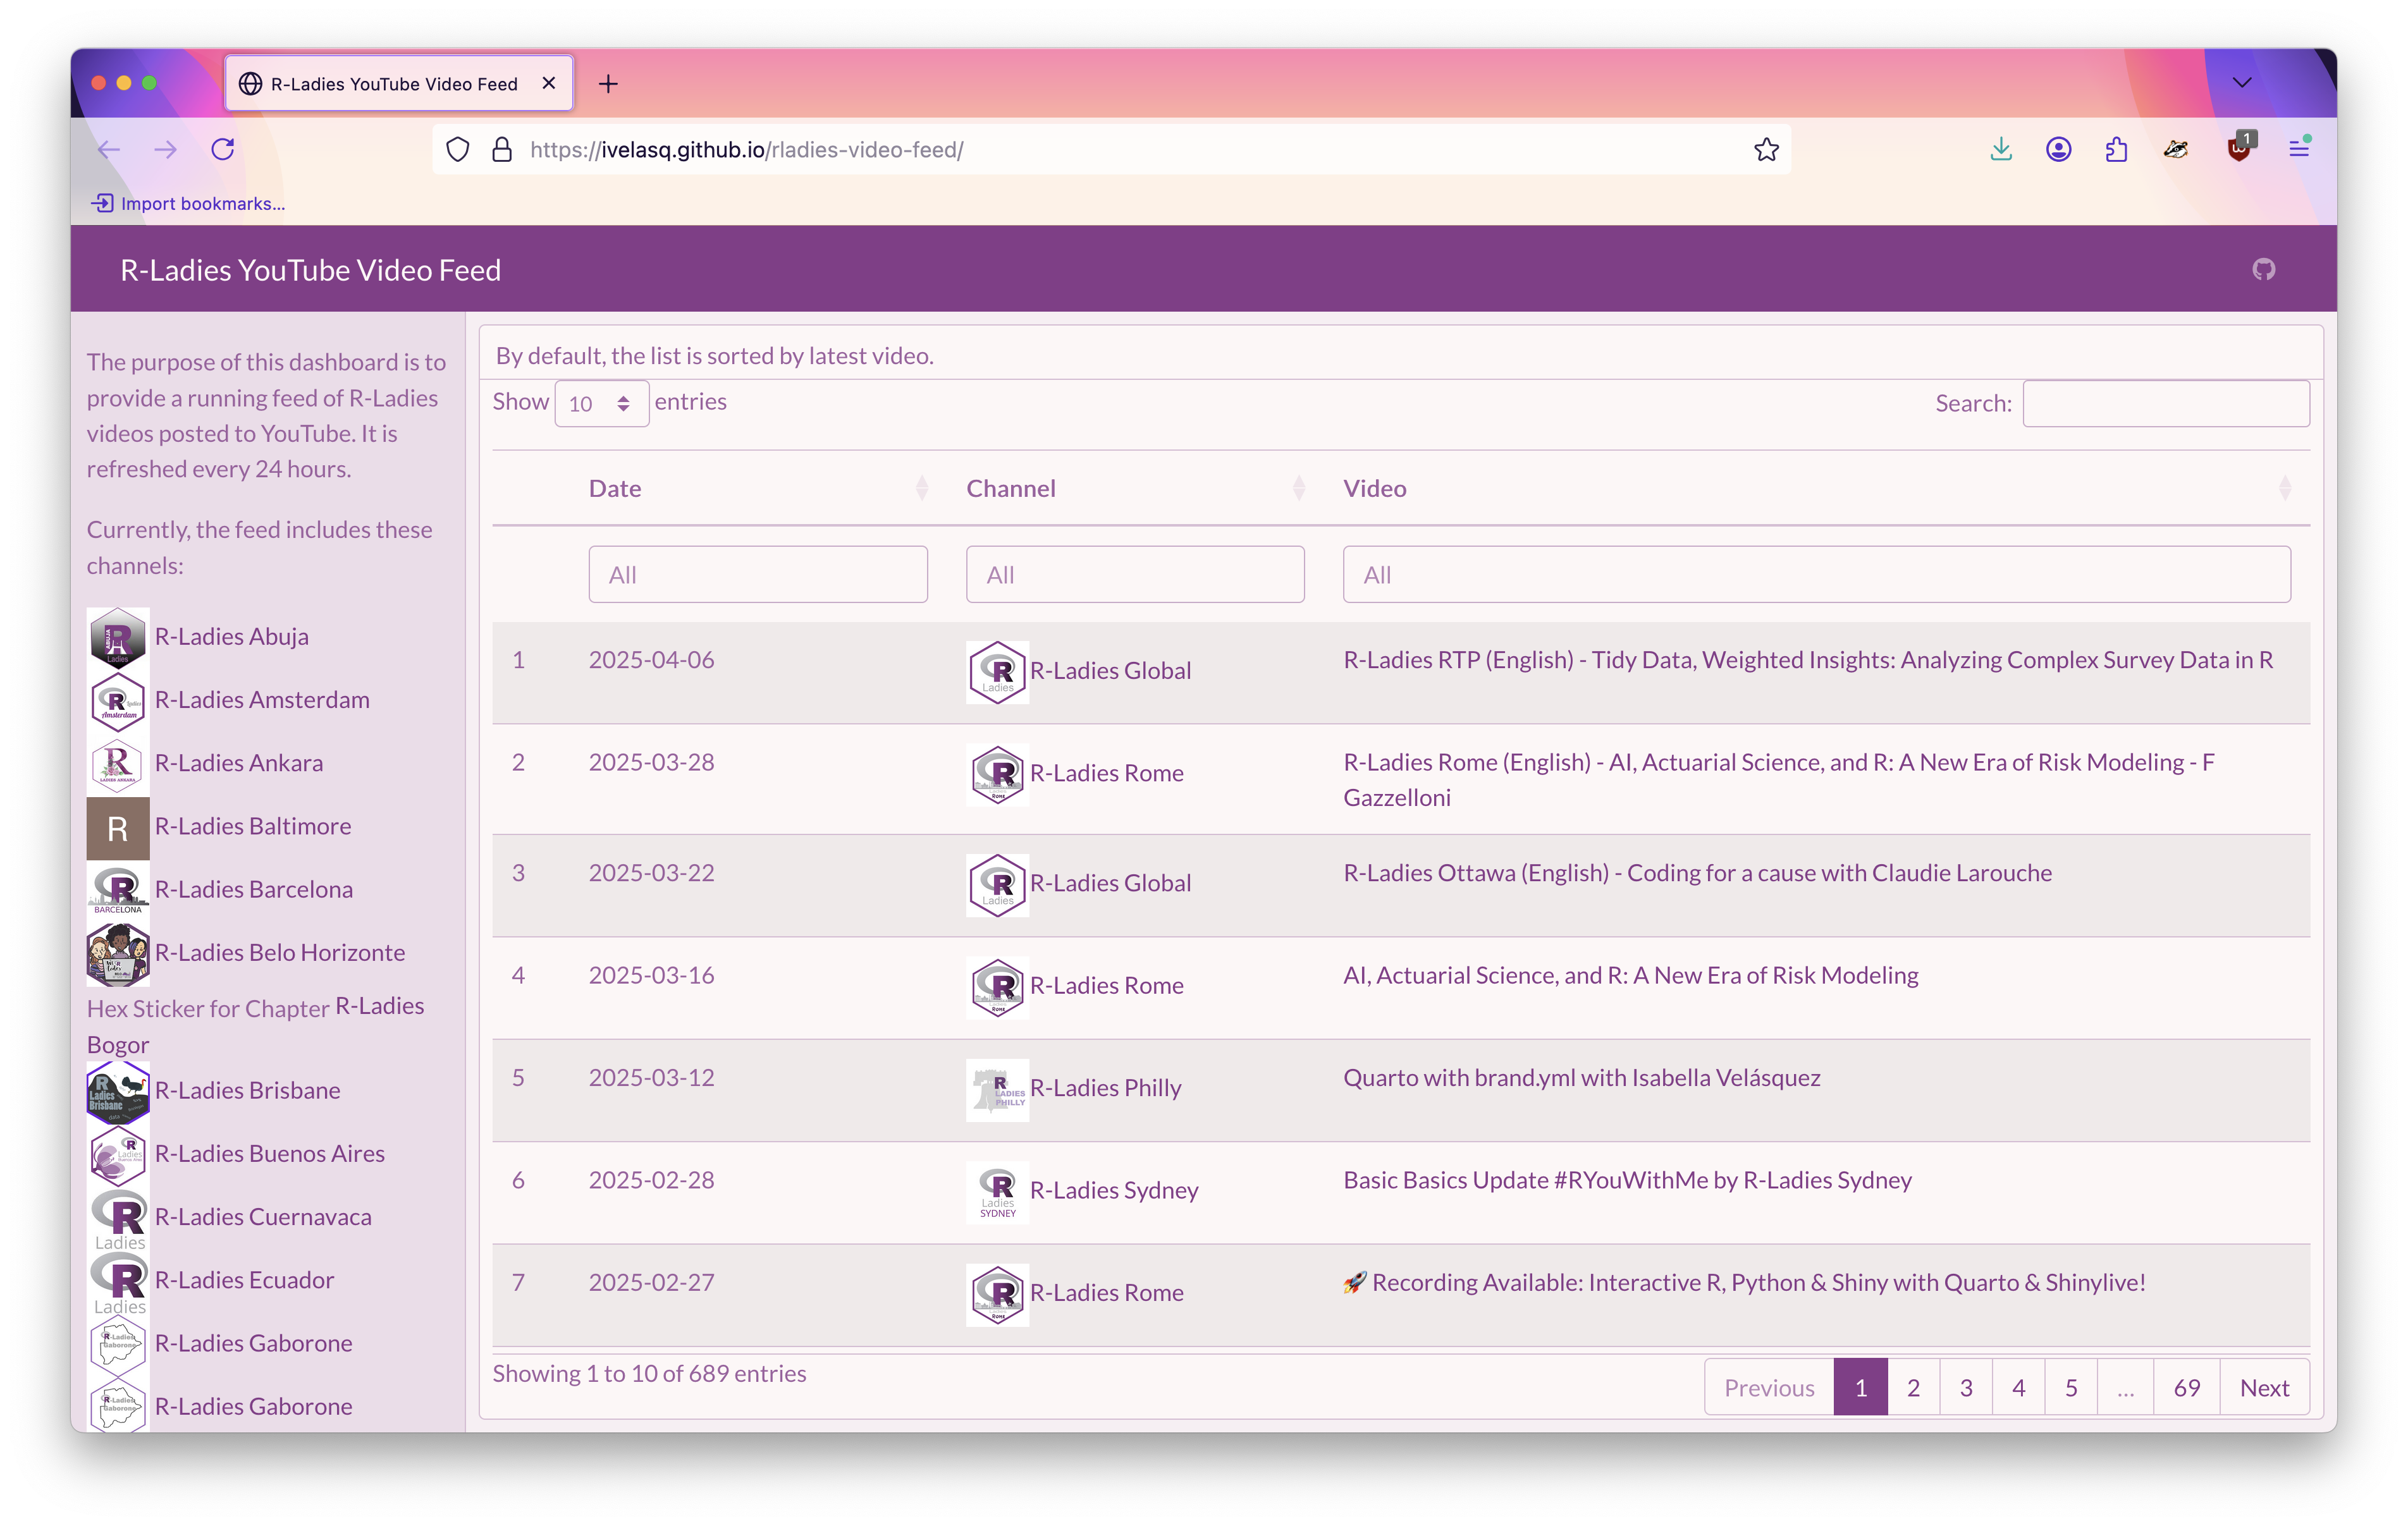
  • Purpose: Display a searchable table of R-Ladies YouTube talks
  • Audience: General public
  • Data Source: Public YouTube metadata
  • Update Frequency: Weekly, via GitHub Actions
  • Hosting: GitHub Pages (free, static HTML)
  • Interactivity: Client-side filtering with the {DT} package (no Shiny needed)

Example 2: Conference Workshop Registration Tracker

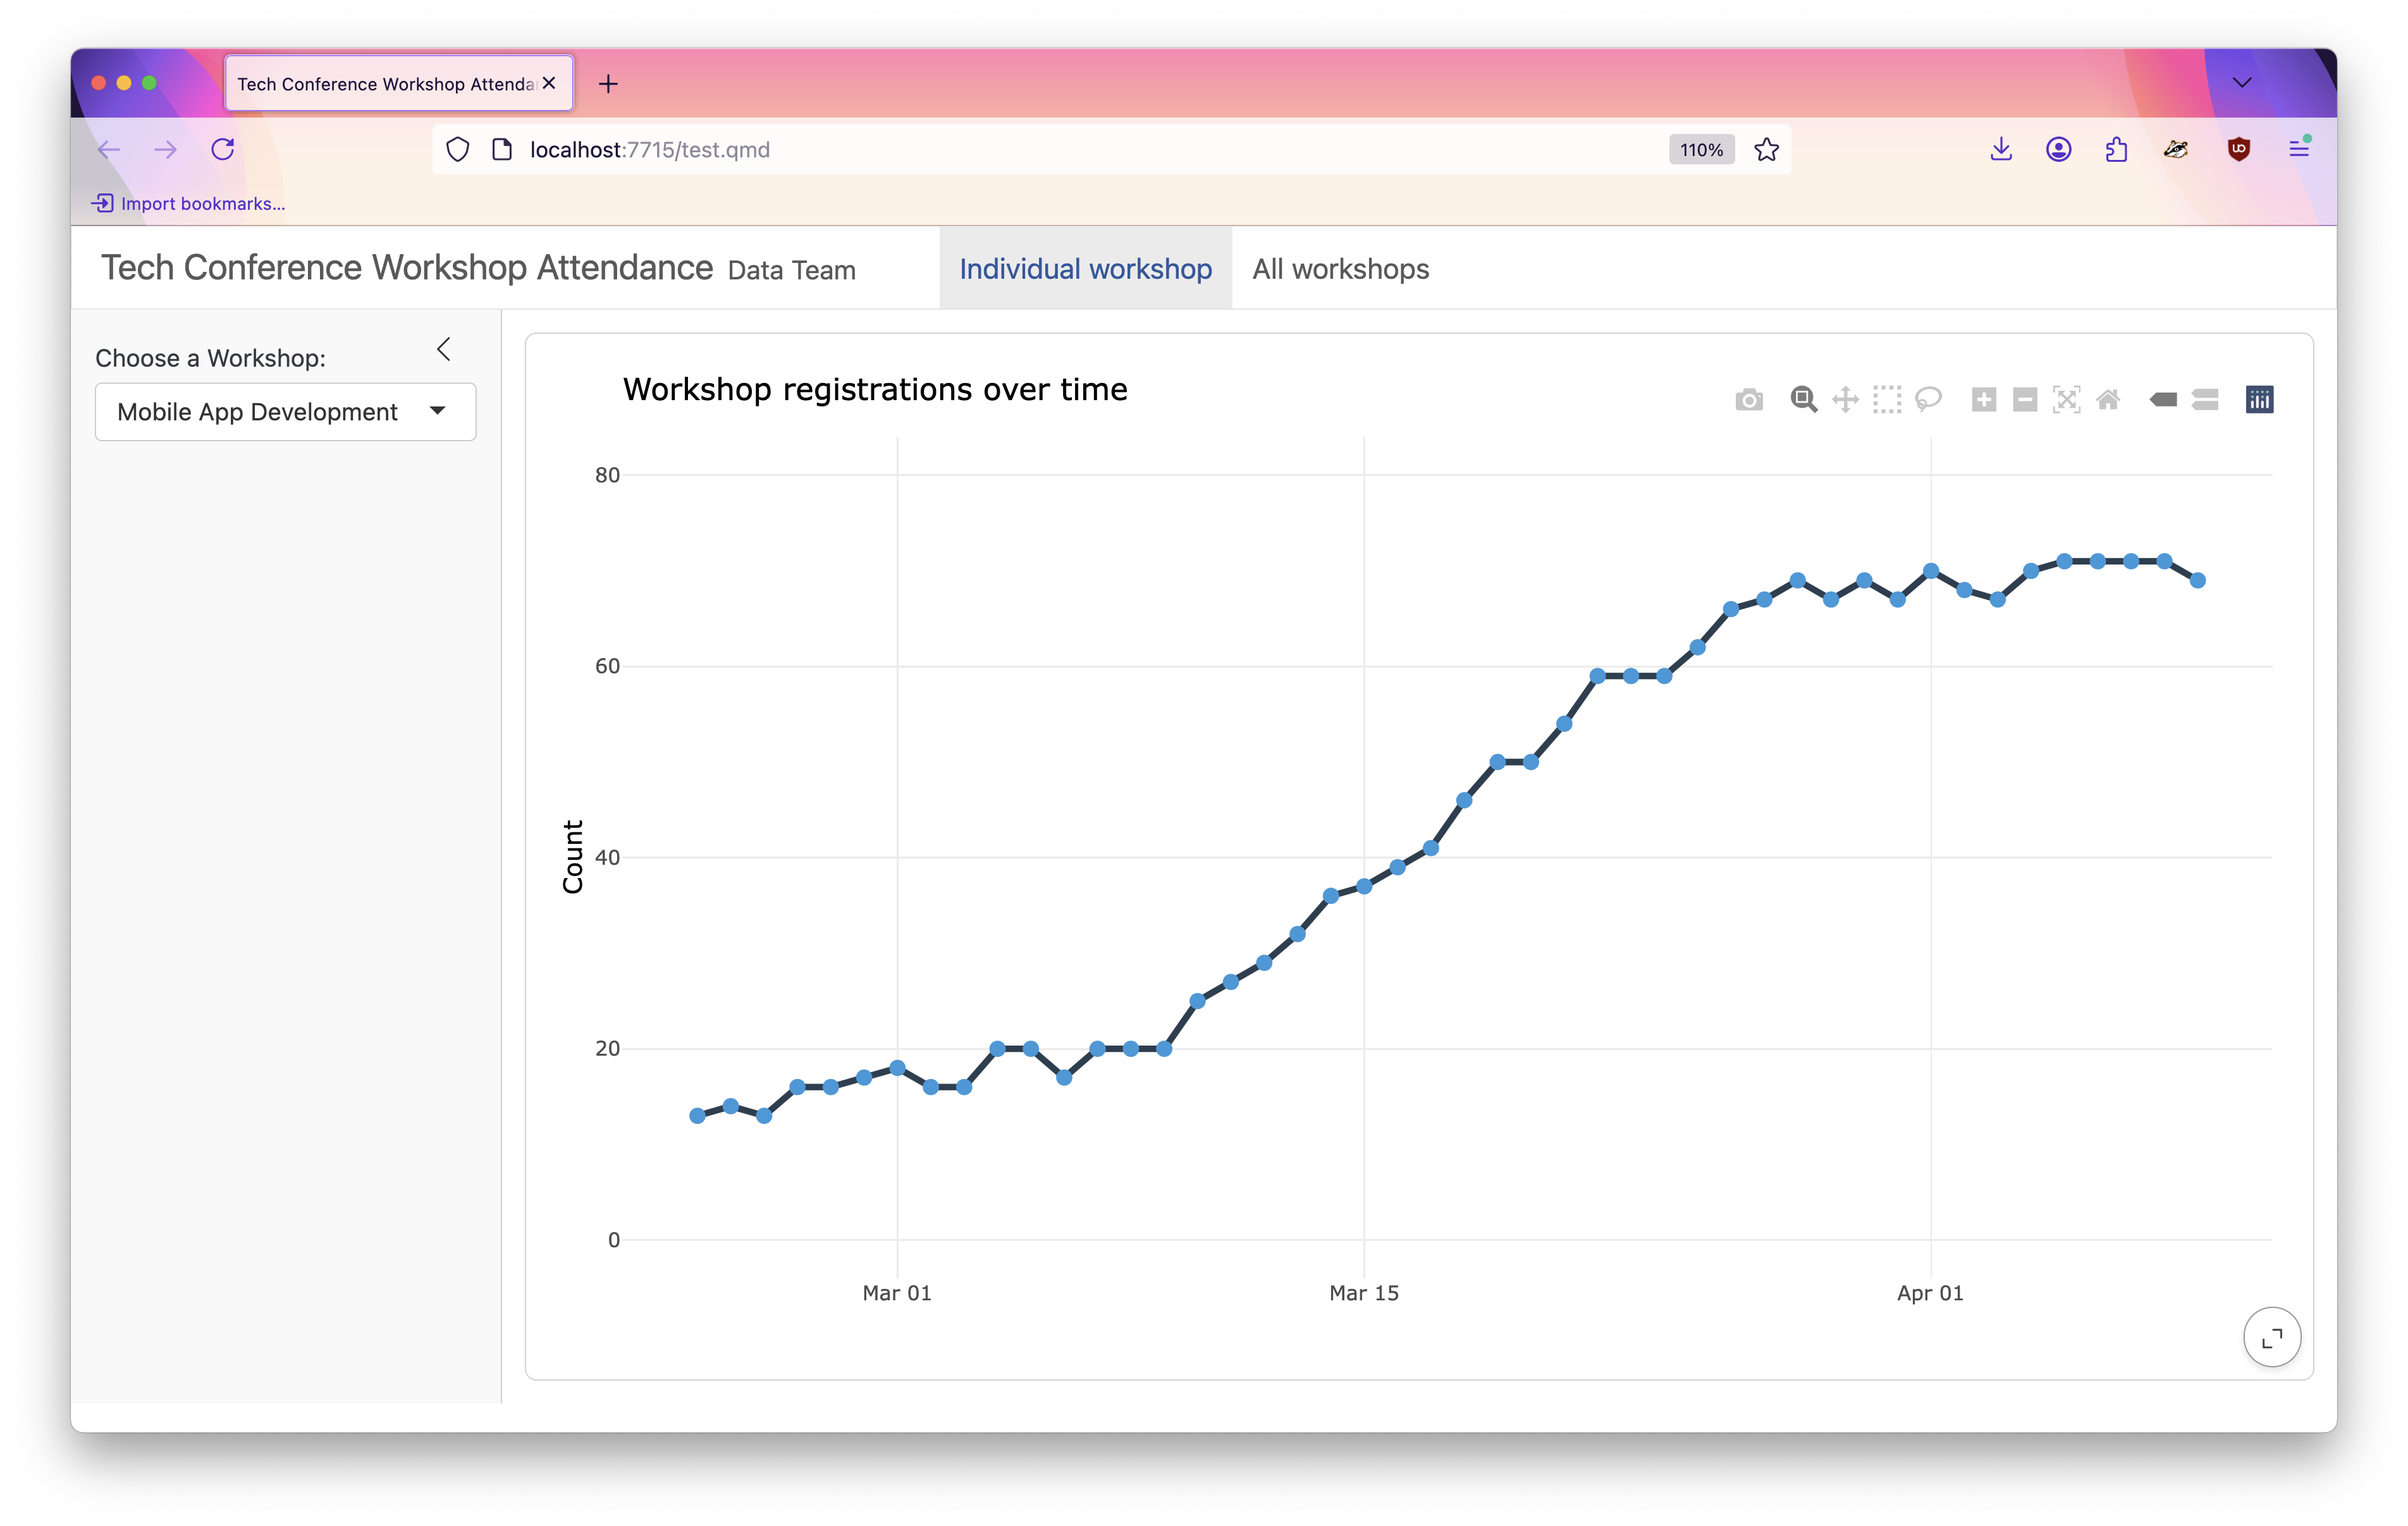
  • Purpose: Show workshop registration trends over time
  • Audience: Conference planning committee
  • Data Source: Private registration data (via API)
  • Update Frequency: Daily, using {pins}
  • Hosting: Posit Connect (secure, internal access)
  • Interactivity: Reactive filtering to explore individual workshops

Example 3: Content Calendar

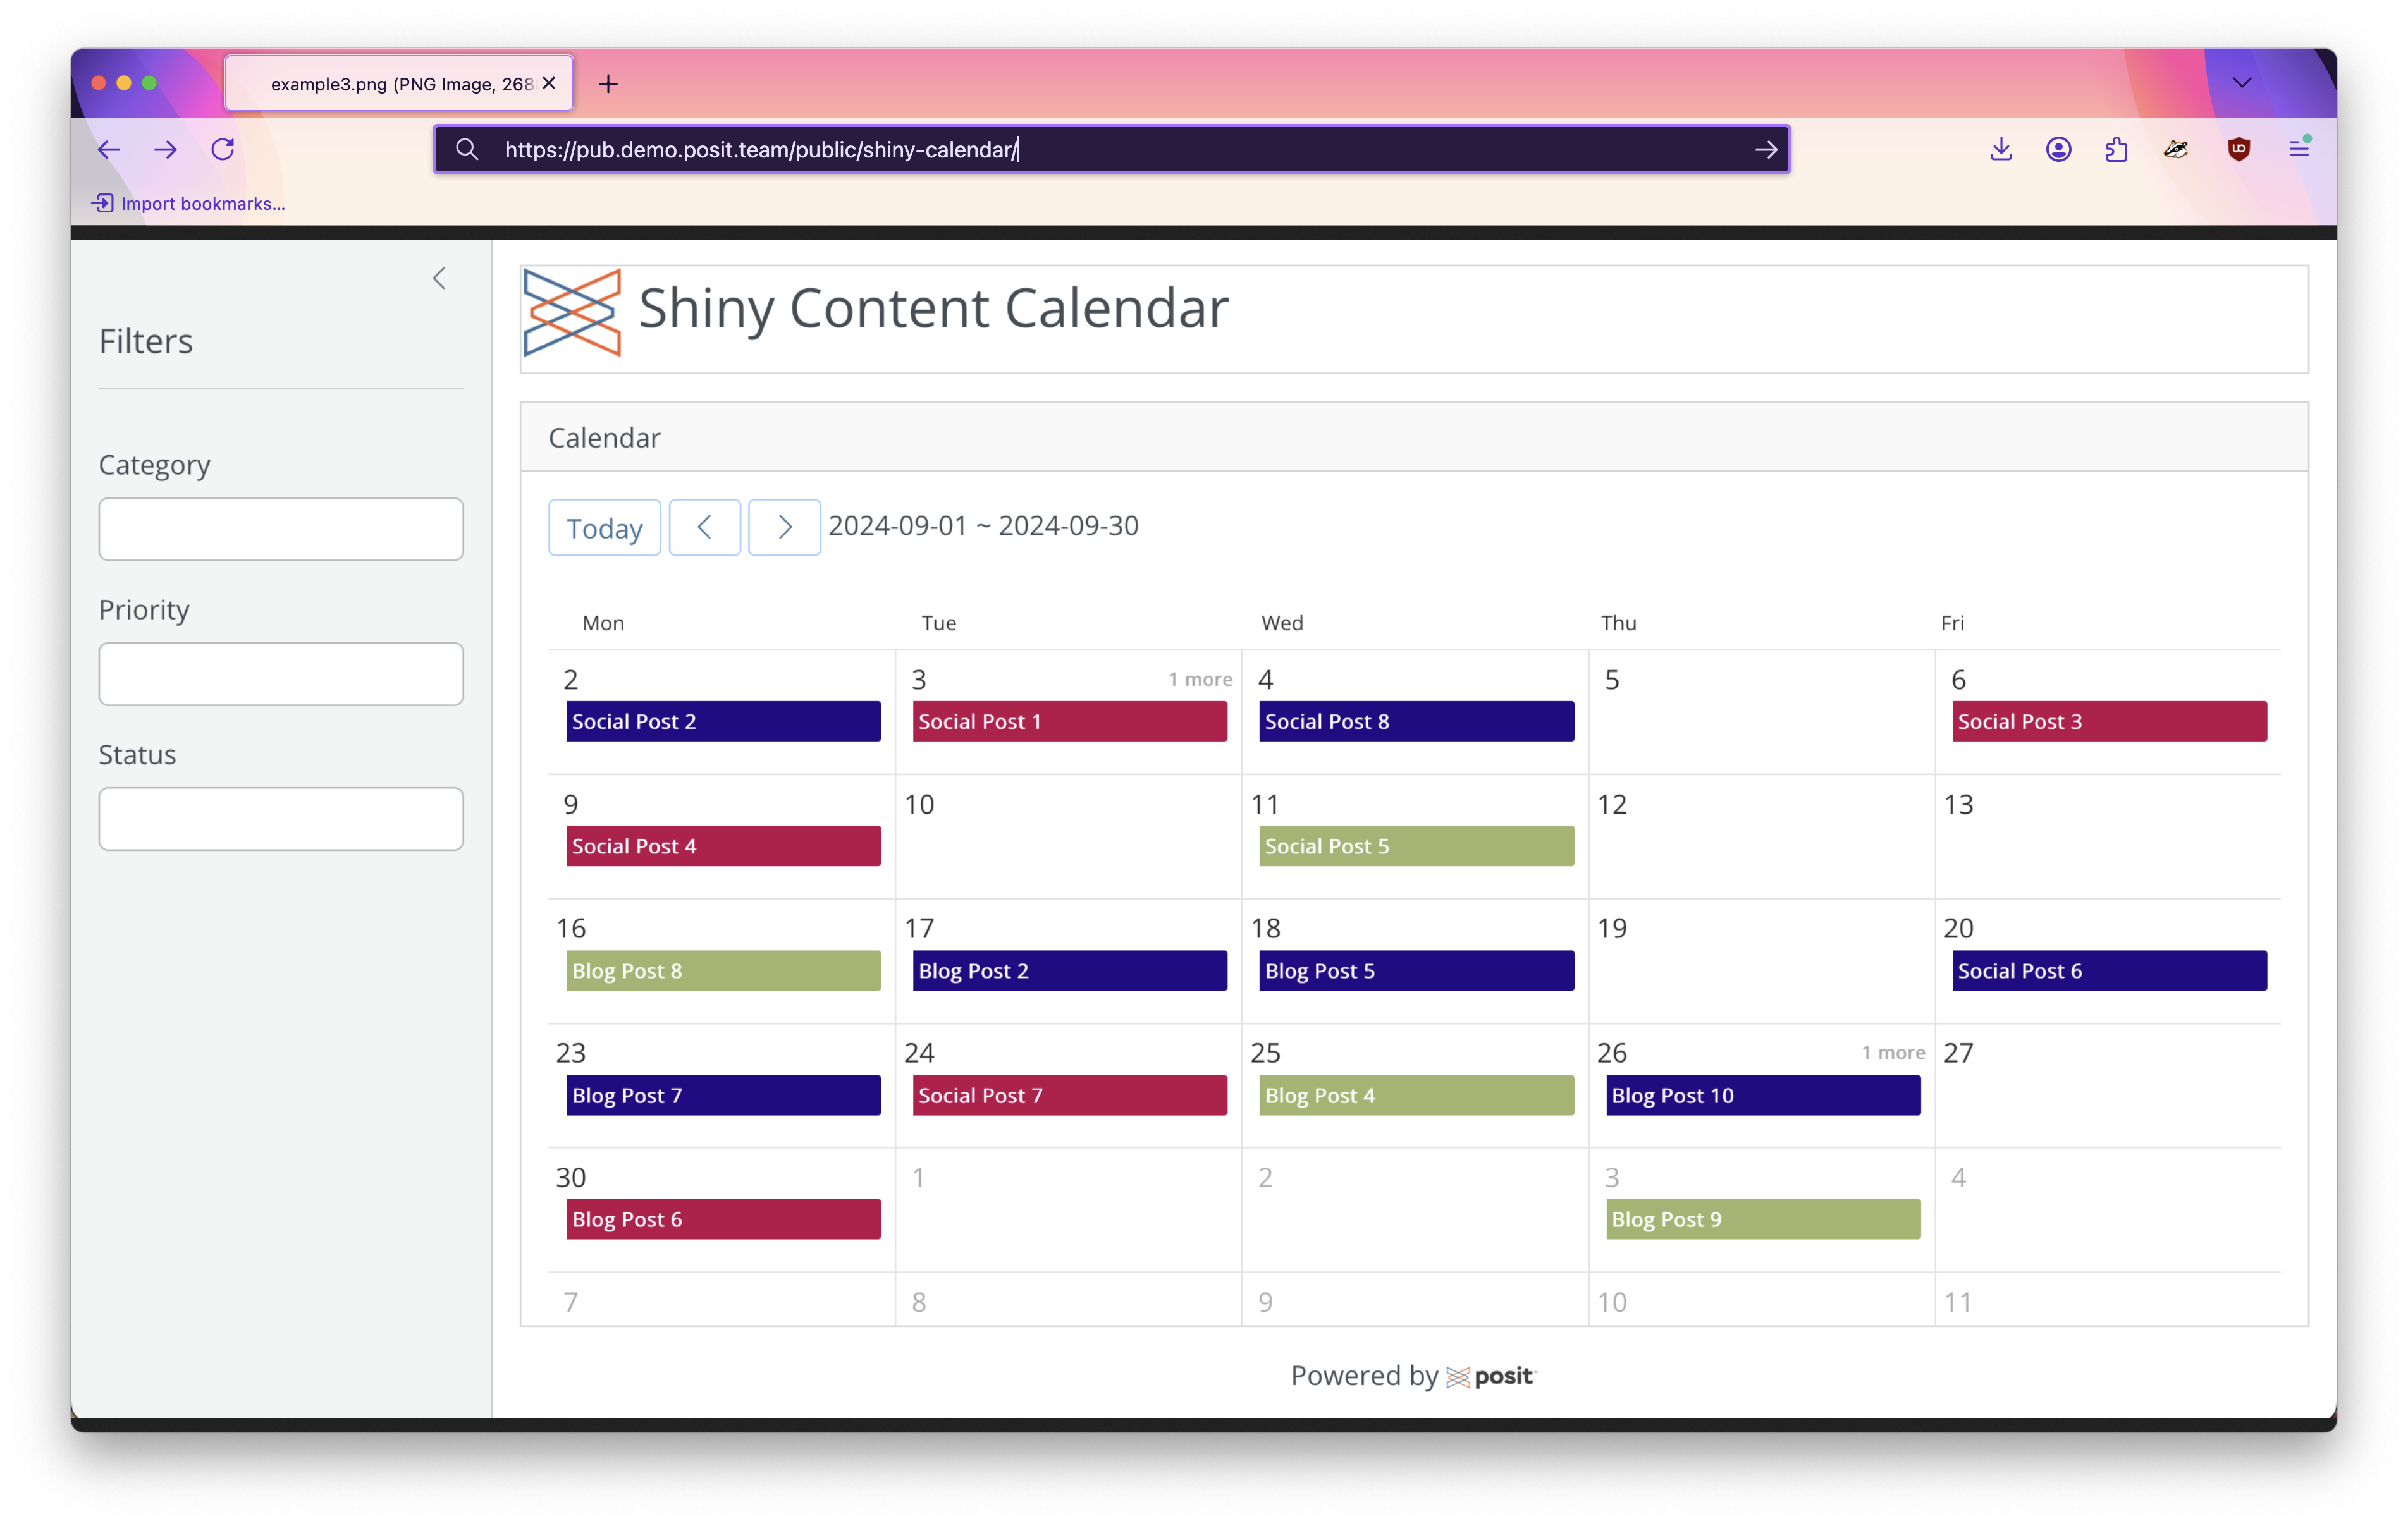
  • Purpose: Show upcoming events in a calendar view
  • Audience: Social Media Committee
  • Data Source: Private scheduling data (via API)
  • Update Frequency: Daily refresh using {pins}
  • Hosting: Posit Connect (secure, internal only)
  • Interactivity: Reactive calendar with {toastui} htmlwidgets

Parting thoughts

Key Takeaways

  • There’s no one-size-fits-all solution.
  • Reactivity, complexity, and hosting should all be weighed carefully when selecting your tool.
  • Consider trade-offs like scalability, security, and future maintenance when making your decision.

Recommendations

  • Revisit your planning questions: Does your chosen tool meet all your needs, or are there trade-offs you should reconsider?
  • Test and iterate: Start small with a prototype and see how it performs before fully committing.
  • Stay flexible: Your project’s needs may evolve, and so may the tools.

Thank you!

@ivelasq

@ivelasq3

@ivelasq3

ivelasq.rbind.io

Acknowledgements

Thanks to all who provided input:

  • Carlos Scheidegger
  • Coulter
  • Daniel Chen
  • Dana Alsaialy
  • George
  • Sara Altman
  • Randy Zwitch
  • Yuri Kim

Images provided by RawPixel

Deployment of reactive dashboards

Server

On-Prem

Serverless

Using Shinylive